Following the IHR Library’s user survey conducted in April 2016, the library team have been undertaking further, more in-depth user experience (UX) research to establish the multitude of ways in which our readers use the library space. This research is intended to identify areas in which the library can be improved and to gain insight into user requirements of the library.
Library staff have therefore been researching methodologies and current trends in user experience research. A range of interactive and creative tasks were then selected to best establish a snapshot of our users, their research behaviours and the ways in which they use the library. These research activities included conducting focused one-to-one interviews with a range of researchers, asking users to take staff on tours of the library, and to participate in a cognitive mapping exercise.
In total eight cognitive maps were collected, with each varying greatly both in style and content. This has provided staff with a varied dataset to help facilitate better understanding of library users’ perceptions of the building, physical space of the library and of the Institute more broadly. Further information about this exercise and examples of some of the maps collected are detailed below.
Cognitive Mapping Exercise:
In recent years, cognitive mapping has become a popular tool amongst library practitioners to gain insight into user behaviour and experience. As Ned Potter has outlined, ‘cognitive mapping is in essence asking your subject to draw a map of the library – or, ideally, of their wider learning landscape – in order to understand how they perceive the space, what they actually use, what they value and see as most important and so on.’ (Ned Potter, ‘UXLIBS 4: Ethnography You Can Try at Home‘, UX Adventure, 2015)
Consequently, IHR library staff recently asked eight researchers to draw the IHR library, or the IHR more generally. Participants were asked to alternate the colour of pens every two minutes for a total of three colours over six minutes. This technique is used to place items in the order in which they were drawn, indicating areas of importance. Participants began with a red pen, then changed to blue, before concluding in black pen.
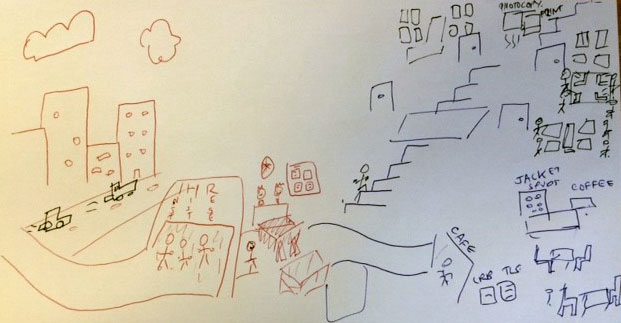
Figure 1
One participant chose to depict the ‘journey’ to get to the Institute, drawing the hectic and chaotic world of central London outside the IHR (Figure 1). In their map, the library was described as representing something of a haven for quiet, contemplative research and work. The participant therefore drew streets, cars and surrounding buildings, however the only people included on the map were within the IHR itself, highlighting the participant’s view of the IHR as a social and inviting space.

Figure 2
Similarly, another participant opted to fill their map with people and key sites of interaction (Figure 2). They spoke of depicting the IHR as a ‘community’ in their map. In drawing the Institute as a whole, the common room and the reception area were common factors across all eight maps, suggesting these as significant sites in the make-up of the Institute. This also indicated that so-called ‘break-out’ areas within the library were key considerations for participants.
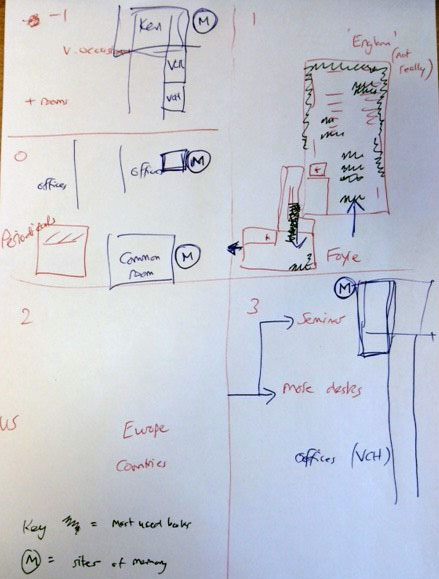
Figure 3
In addition, during discussions explaining their maps three participants highlighted the location of sites within the current library in relation to where they had been prior to renovation of the building and the IHR’s time in the South Block of Senate House. In this regard, one participant drew ‘sites of memory’ on their map – these represented both areas of particularly fond memories and recollections, but also previous locations of the library’s collections (Figure 3).
As noted previously, all eight maps were drawn in very differing styles and in varied formats. While some were formulated in a logical manner and floors were depicted in a rigid structure, others missed out areas and one participant was unsure of how many floors in total the IHR has – writing on their map ‘Missing Floor?’ between the second and third floor landings. The relative lack of detail attributed to the North American room on the second floor and to the third floor across all eight maps suggests a need to review the physical environments of these areas of the library.
Further analysis of the cognitive maps and in-depth participant interviews will take place in the coming weeks. The IHR library team are immensely grateful to all participants and for allowing the reproduction of a selection of the cognitive maps collected here.
Library staff would welcome any feedback on any aspect of the library and on the user experience research they are conducting. If you would like to provide feedback, please contact library staff via the library enquiry office, email ihr.library@sas.ac.uk or phone 020 7862 8760.
For further information on the methodology of utilising cognitive mapping in library user experience research see:
Andrew Asher, ‘Coding Library Cognitive Maps‘, BiblioEthnoHistorioGraphy: A Critical History of Library Ethnography (2013)
Donna Lanclos, ‘Post-Digital Learning Landscapes‘, The Anthropologist in the Stacks (2014)
Ned Potter, ‘UX in Libraries Resource List: a structured introduction to UX and ethnography‘, UX Adventure (2016)
Andy Priestner and Matt Borg, User Experience in Libraries: Applying Ethnography and Human-Centred Design (Routledge, 2016)