This post was written by Alex Kither, Graduate Library Assistant Trainee at the Institute of Historical Research Library.
The new Modern History Collections guide covers a broad range of historical sources from the late eighteenth century through to the present day. The collection is eclectic and represents periods of extreme instability, conflict, and change. The theme of ‘revolutions’ is well documented across the library holdings: both representing shifts in political and social paradigms, but also in commerce, technology and industry. A notable section of the guide is dedicated to the industrial and infrastructural innovations of the nineteenth and twentieth centuries, with a significant sum of sources pertaining to the development of London and its environs. A unique strength of these modern collections are the substantial number of maps and atlases that detail the emergence of the industrial city.
These historical maps offer an illustrated guide through the various topographical developments of the capital throughout the modern age. However, these resources offer more to the historian than just an overview of street names and buildings. They also chart the development of infrastructure and industry across the city during this transformative period in British history. A prime example to be found among our collections is James Reynold & Son’s brightly-coloured 1886 ‘Distance Map of London with recent improvements’. Once folded out in its entirety, the map details an elaborate industrial metropolis at the end of the nineteenth century, supplemented with a guidebook from the author.
Other maps describe the sprawling network of transport infrastructure that grew across the city during the latter half of the 19th century, such as ‘Davies new map of London : showing the railway stations and all modern improvements’ and the official 1900 Railway diagram of London and its suburbs, certified by all the companies whose services it encompasses. Beyond their value in supplementing historical research, these documents serve as significant historical sources within their own right.
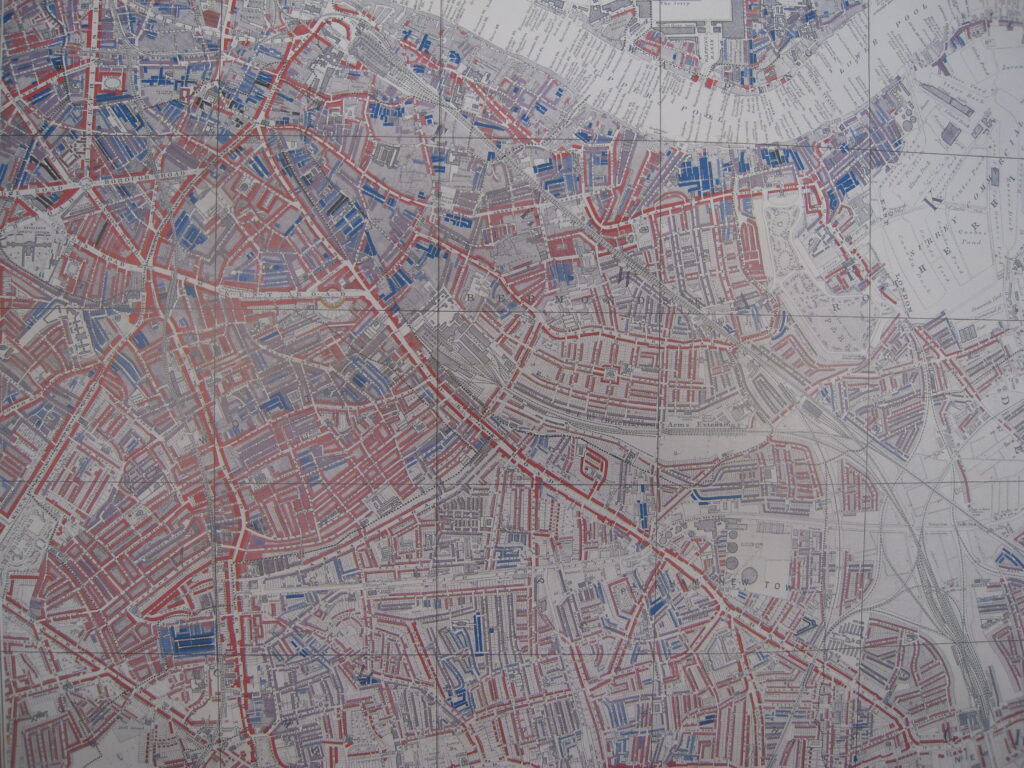
Charles Booth’s Descriptive map of London poverty 1889 – Bermondsey and other lower income areas South of the Thames represented in blue and grey.
In addition to highlighting the industrial progress of the capital, these maps also reflect upon the social and economic consequences of industrialization and development in the city. Charles Booth’s Life and Labour of the people in London and Descriptive map of London poverty 1889 are examples of an early experiment in the use of topography to describe the social conditions of Londoners. Booth uses these descriptive maps to identify the social class of the residents of London during the late Victorian period and offers a unique interpretation of post-industrial social inequality that could not otherwise be communicated in words alone. Booth’s colour-coded system illustrates the most deprived neighbourhoods (in black and blue) through to the wealthiest (aptly represented in gold and identified as having at least three servants and property valued over £100). From a glance, you can clearly identify the difference between the well-to-do townhouses of Belgravia and the ‘blue to black’ poverty lining the Thames at Wapping and Limehouse.
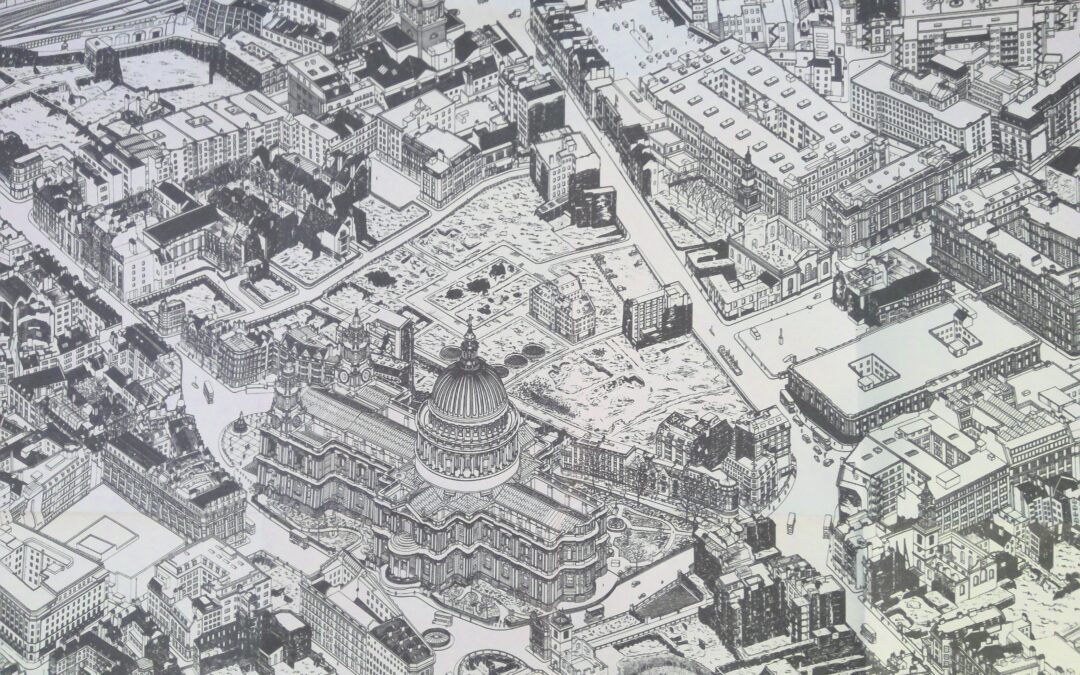
When conflict broke out across Europe in the former half of the twentieth century, once again cartographers stepped in to illustrate the effects of war upon London. Cecil Brown’s artistic rendition of Devastated London details the view of the bombed city as seen from a barrage balloon in 1945. While not as analytically descriptive as other maps in our collection, Brown’s map presents a highly detailed isometric portrayal of the city, with barren bomb sites and rubble between familiar streets and monuments. The map is dedicated by the artist to the citizens of London, and reads:
“You worked. From your needed efforts you would not be deterred. You carried on and from your midst arose no cry for mercy, no wail of defeat. Your faith and endurance have finally been rewarded.”
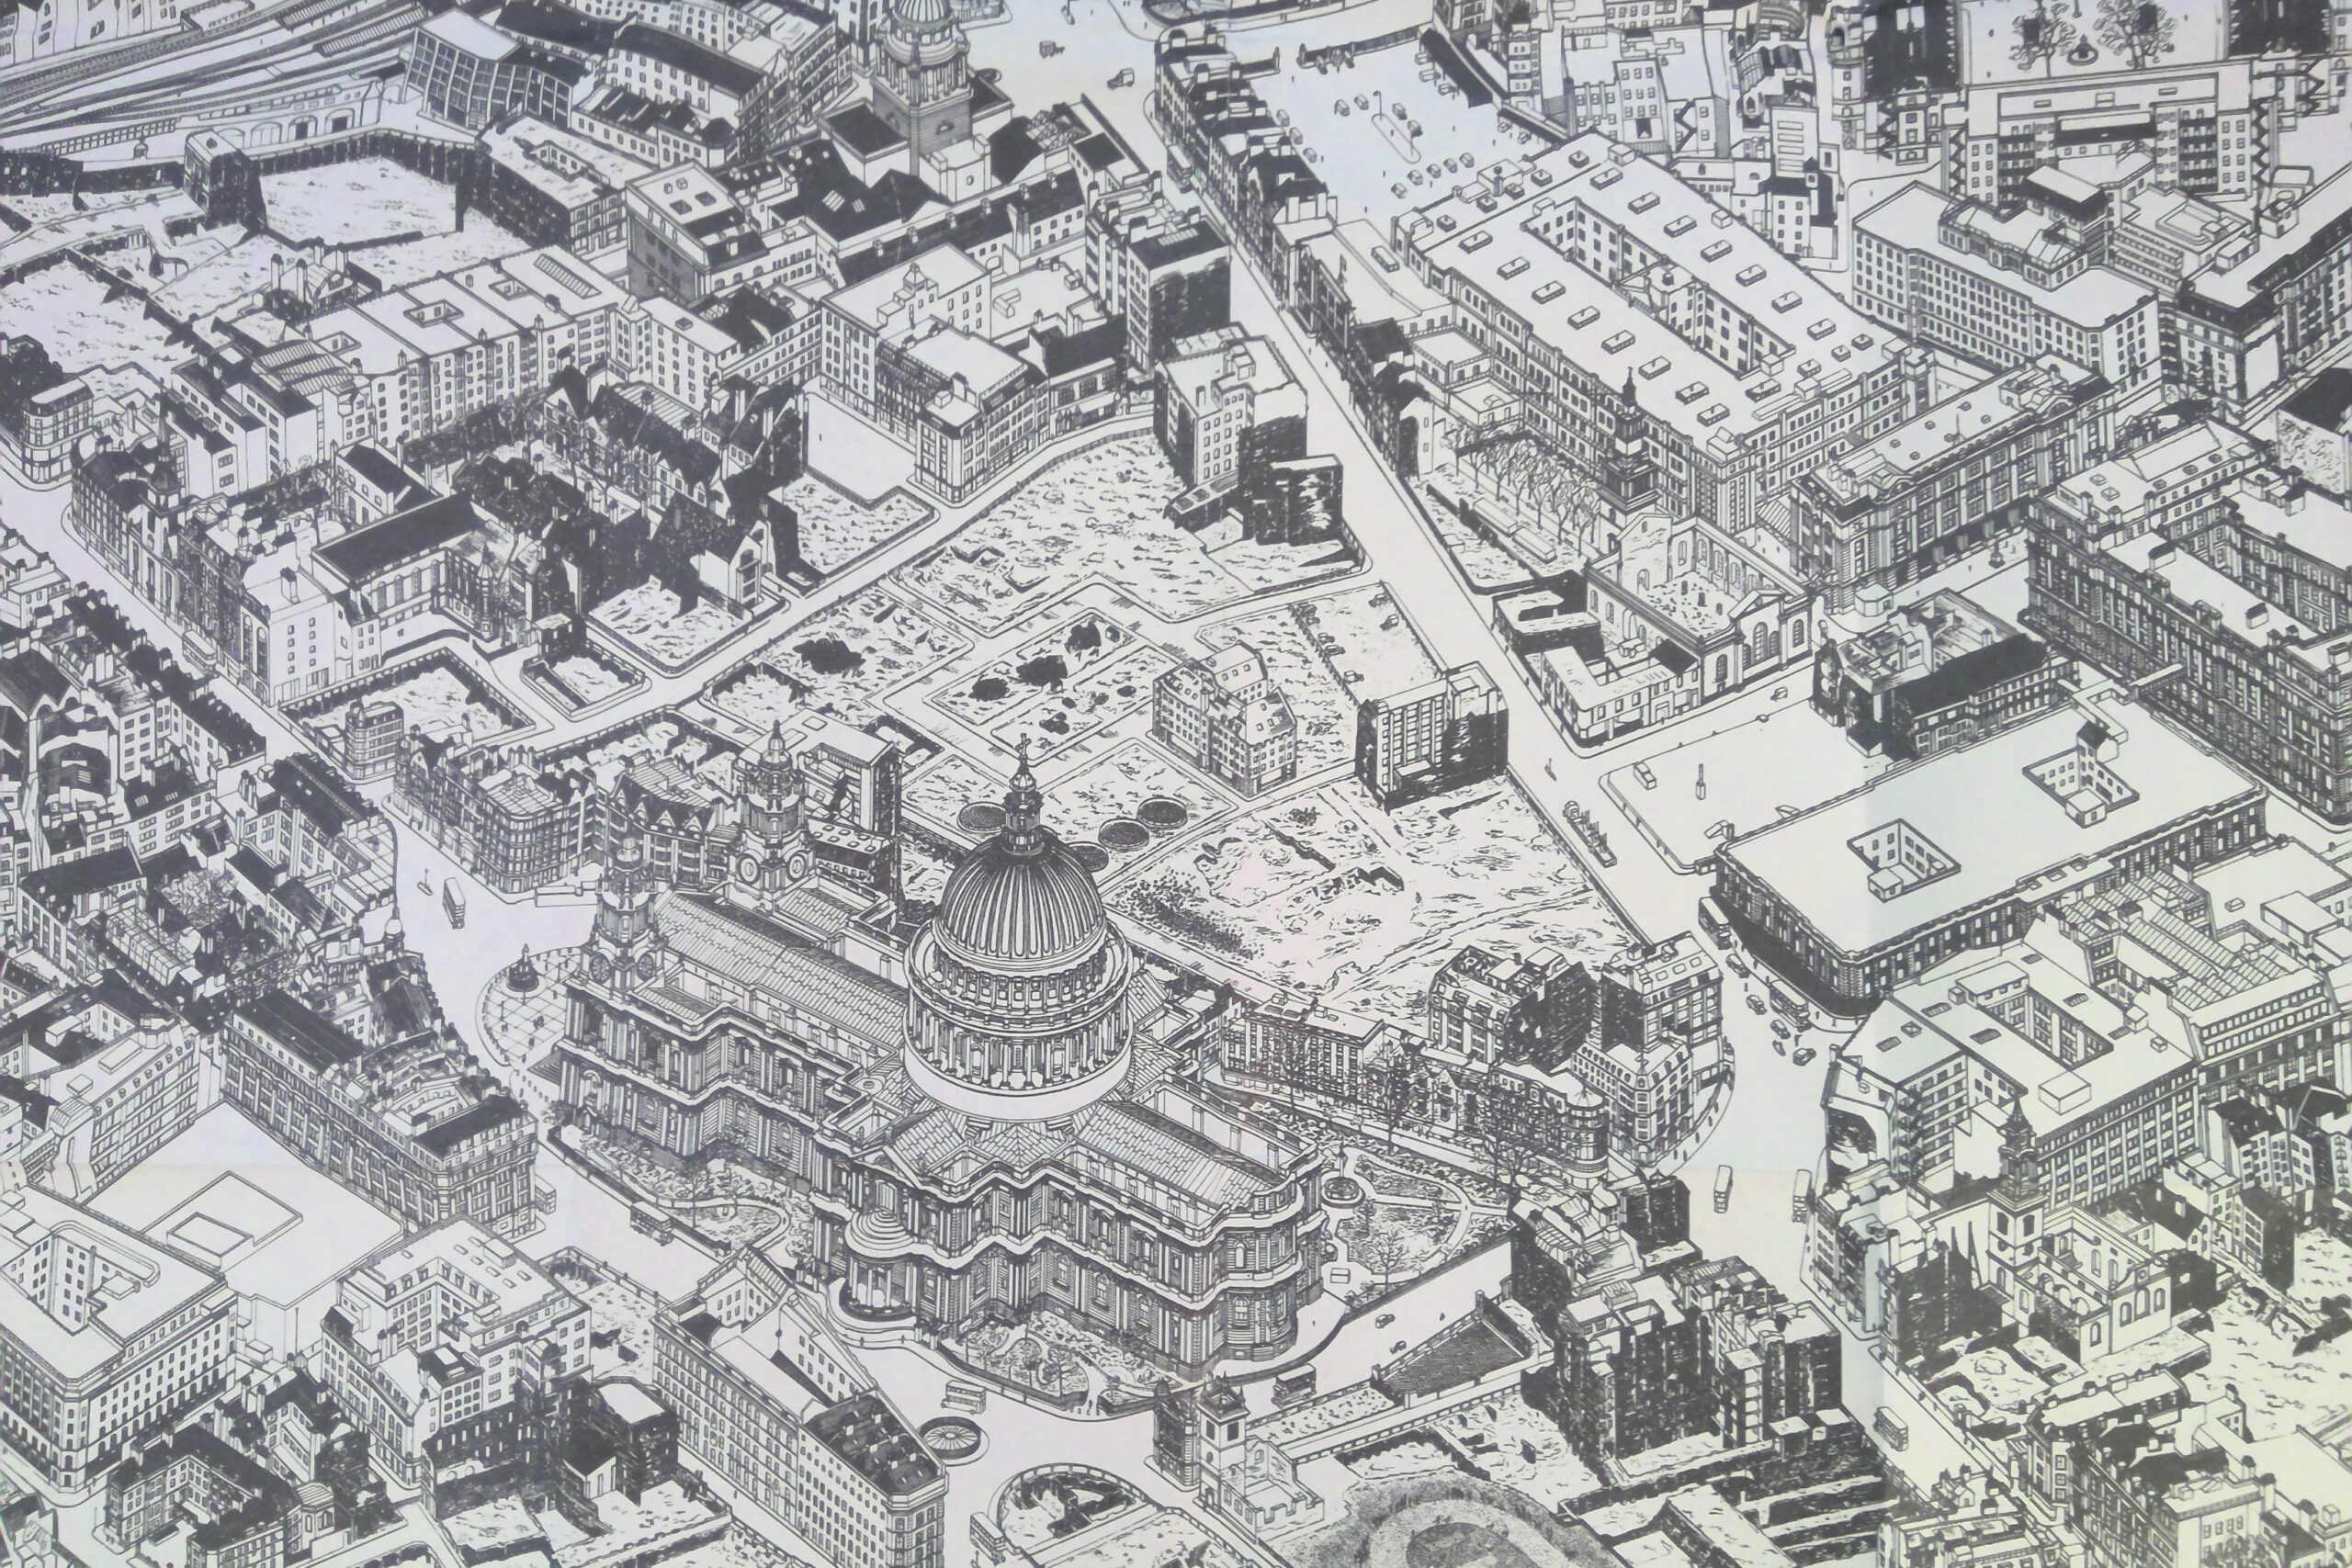
Cecil Brown, Devastated London : the bombed city as seen from a barrage balloon, 1945.
The tradition of mapping the history of London is one that remains alive and well in the 21st Century, not least thanks to projects such as Layers of London, which can be found amongst the library’s guide to free online resources.
Our modern collections span beyond the capital. The library also holds a wide variety of map-related materials of English counties during the modern period, each shelved within the individual county collections, from Avon to Yorkshire. In addition, we hold an enormous wealth of near three hundred ordinance survey maps that cumulatively cover the width and breath of the United Kingdom. Together, these maps detail the gradual spatial, geographic, and topographic changes to the landscape over two centuries of industrial development. Other areas of the collection provide maps of emerging transport links across the breadth of Europe, from the canal systems of 19th century France to the cycle routes of Belgium and Luxembourg. Following these maps and atlases can lead to historical discoveries otherwise not recorded in words and provides a useful selection of source materials to modern historians.
Three new guides to the IHR library show some highlights by period: medieval history, early modern history and modern history and researchers can find much more across the library’s collections.